July 15, 2024
Longer interval between maternal RSV vaccination and birth increases placental transfer efficiency
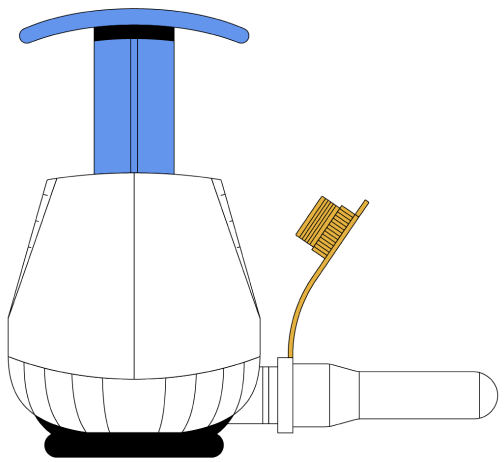
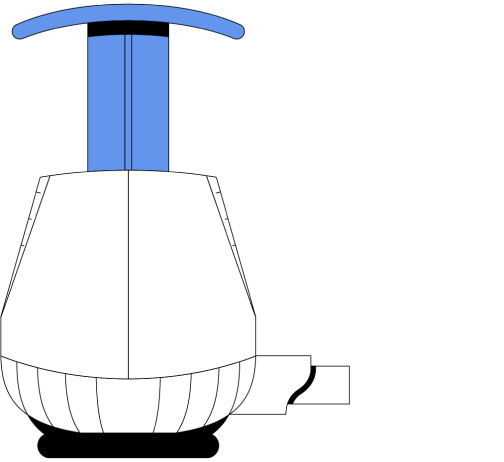
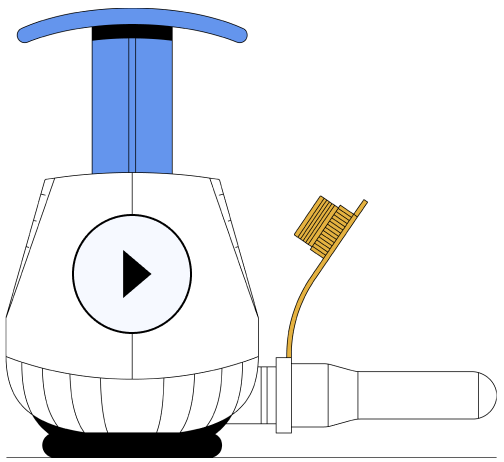
TAP was employed to collect capillary blood from 2-month-old infants for antibody tests of RSV and pertussis toxin.
Read More