-
Whitepaper
Illumina Infinium Microarrays: MethylationEPIC Array
HIGHLIGHTS
- The TAP is a non-invasive and virtually painless blood collection device that enables point-of-care, high-quality whole blood collections for downstream molecular applications such as methylation profiling by microarrays.
- The Illumina Infinium Methylation EPIC array kit enables cost-effective and comprehensive epigenome-wide association studies (EWAS) for over 865,000+ CpG sites.
- Raw data concordance assessments for microarray quality metrics (such as scatter plot assessments of average beta, correlation values (R-squared), cluster analysis for automatic sample pairing detection, dendrogram analysis for likeness, human ID RS-site analysis for sample identification and genotype plotting of AA/AB/BB genotypes within the array) demonstrate quality control equivalence between TAP vs traditional venipuncture collections.
- Applications for high-throughput blood collection coupled to high-throughput methylation profiling enables efficient global EWAS for research and diagnostic applications.

INTRODUCTION
DNA methylation is an important factor in the context of gene expression and regulation. Methylation status of loci are important for research applications in cancer, aging, molecular epidemiology, genetic diseases of development, disease progression pathology and more. In a similar fashion to genome-wide association studies (GWAS), EWAS enables discovery applications, and the MethylationEPIC BeadChip array enables quantitative detection over hundreds of thousands of qualified sites with continuous review. Over 865,000 CPG sites (865,918 site specific calls) incorporate gene bodies, promoters, enhancer regions and CPG islands. The array also incorporates non-CPG methylated sites identified in human stem cell sites, ENCODE open chromatin and enhancers, FANTOM5 enhancers, DNase hypersensitivity sites and miRNA promoter regions. Sample pooling and indexing is not required, and the iScan or NextSeq550 can be used for image analysis and calls within in GenomeStudio. For each CpG site that is queried, thousands of probes are assessed to provide precise methylation assessments. High analytical sensitivity is achieved as the assay can detect differences in beta values of 0.2 with a <1% false positive rate. Overall, the MethylationEPIC array offers a cost-effective and accessible EWAS tool for high-throughput studies.
Traditional blood collection for the Illumina microarray system involves a venipuncture draw by a trained phlebotomist, whereby 5-10 ml of whole blood is collected in a standard citrate/heparin/EDTA tube. This procedure is relatively costly and inaccessible to scale across large patient populations for point of care testing.
Here, we introduce the Yourbio Health TAP blood collection device as a viable tool to enable feasibility of blood collection scale and adoptability for downstream molecular testing on the Illumina MethylationEPIC array. The TAP enables point-of-care collections by novice users, direct use by physicians/technologists in general practices, or collections in underserved/remote geographies. We obtained paired blood samples (TAP + traditional venipuncture) to analyze downstream Illumina data to demonstrate analytical concordance verification of methylation calls and quality metrics. We assess the average beta, total intensity and other rsID features.Economic and logistical hurdles to high-quality blood collections persist due to the modality of the sample collection process (primarily due to the need of a trained phlebotomist/technician), thereby impeding access to many people for efficient point-of-care testing.
MATERIALS AND METHODS
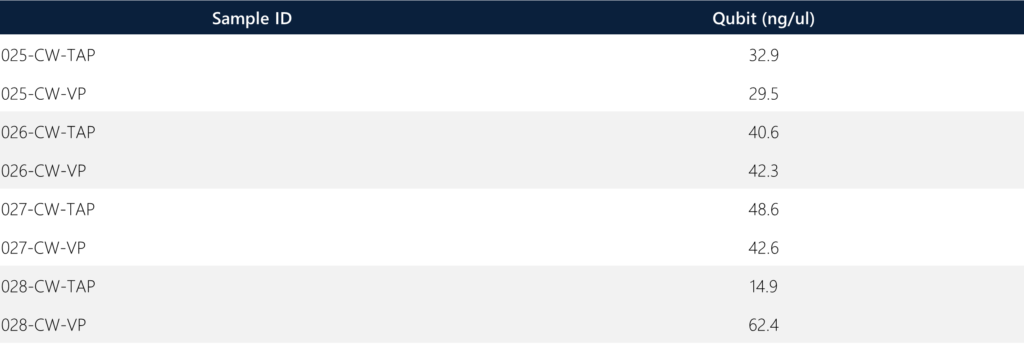
Under an IRB-approved protocol, four donors had paired blood samples collected by a trained phlebotomist (traditional venipuncture tube) and assisted-collections (TAP device) into heparin-coated tubes. The venipuncture tubes collected the full max fill volume of 3 ml by the phlebotomist, whereas the TAP devices collected between 300-600 ul of whole blood. All blood samples were collected and treated identically (same-day shipment to lab on ice packs during transit) in preparation for downstream DNA extraction and library preparation for WES. Briefly, DNA extraction was performed with the Qiagen QIAamp DNA blood mini kit (pn 51104) using 200 ul as whole blood input and 200 ul of elution volume. DNA QC with the Qubit Flex fluorometer using the Qubit DS BR assay kit. Any sample below 40 ng/ul was concentrated to 100 ul of original elution via Savant DNA 120 Speed Vac concentrator. Gel confirmation of product was conducted via E-gel agarose gel electrophoresis system. The entire microarray process spanned 4 days and followed the Illumina microarray methylation protocol. Results were analyzed using GenomeStudio software with the EPIC methylation package.
RESULTS
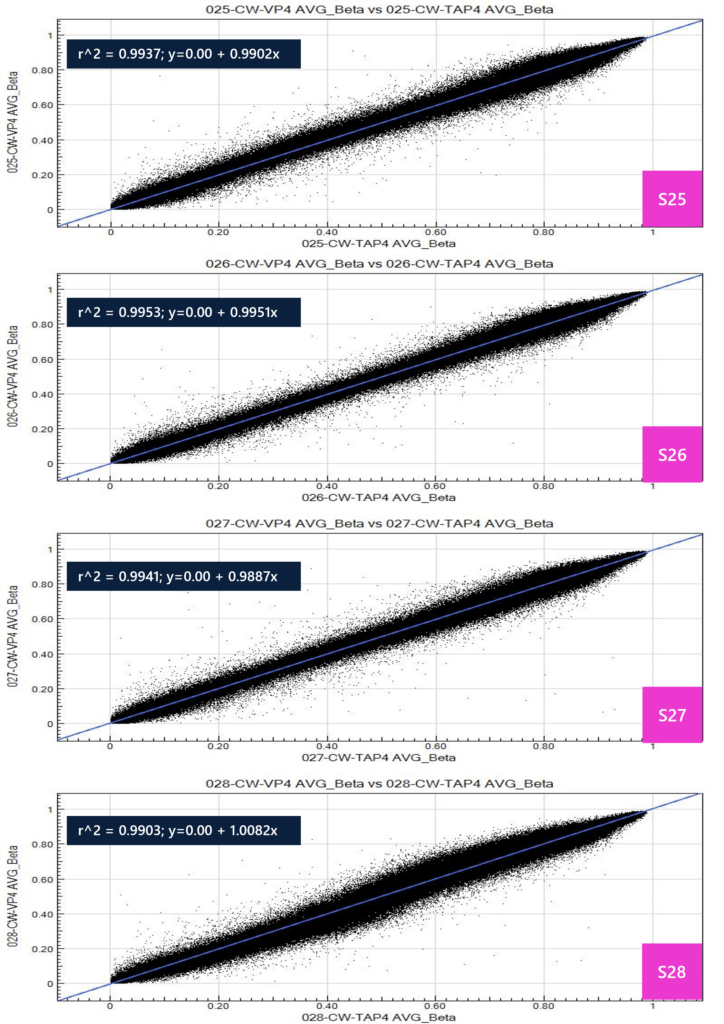
The following table shows DNA extraction QC results. Note that sample 28-TAP has low yield due to low input blood volume (confirmed by operator). All samples passed QC and moved forward with the microarray protocol. The average beta is a measure of the ratio of fluorescence intensity generated from preferential hybridization of target sequence, whereby a value of 0 to 1 is produced. This value is calculated as: average beta = (intensity of signal B) / (intensity of signal A + B + 100). The average beta value is generated across all 865,918 sites in the methylation EPIC array and is represented as a percentage of cells in the input population. Values are generally categorized into three groups: 0 for unmethylated site, 1 for fully methylated, and fractions in between for variable methylation patterns within the population. For example, an average beta value of 0.3 for a particular site may indicate that 30% of the cellular population is methylated at this site. A scatter plot was produced for all samples to assess correlation between TAP and VP for average beta values, whereby all samples show high R^2 (>0.99), indicating highly concordant calls for methylation sites between TAP and VP matrices.
As an alternative method to demonstrate relationship and fidelity of samples, a cluster analysis algorithm was applied to all 8 independent samples to identify pairwise samples that are likely derived from the same individuals. The cluster analysis identified all 4 donor’s paired samples between TAP and VP as indicated in Figure 3.
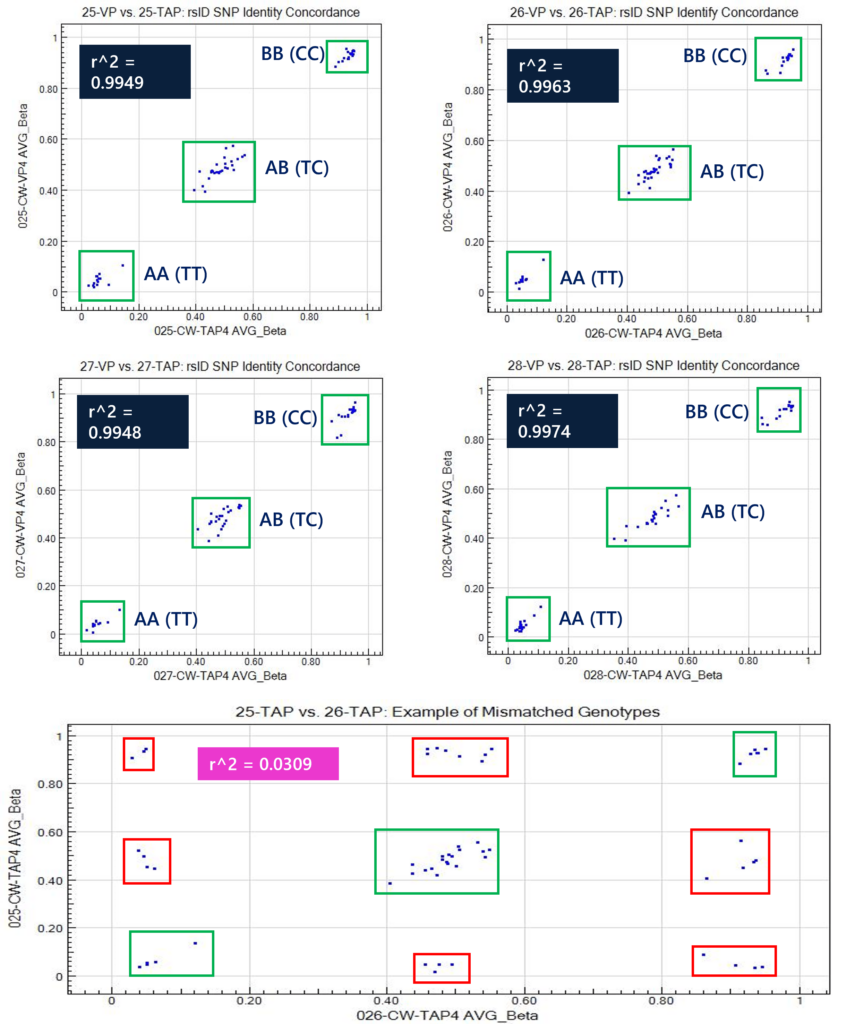
The MethylationEPIC array also houses 59 rsID sites (in addition to CpG sites) as sample identification markers. This method can be used to correlate human SNP identification markers to demonstrate R^2 >0.99 between TAP and VP samples. Samples that are derived from the same individual (i.e. TAP and VP) will have the same genotypic identify at all 59 rsID sites. All four samples demonstrated genotypic concordance of the 59 rsID sites, demonstrating three distinct clusters of calls between the matrices. An example of a mismatched scatter plot is shown between donor 25 TAP and donor 26 TAP to highlight the nine clusters of rsID calls, whereby six of these clusters (Figure 4, red boxes) are not normally produced as genotypic calls. These 59 human identification rsID sites correlate to TT (beta near 0.0), TC (beta near 0.5), and CC (beta near 1) genotypes.

CONCLUSIONS
Initial feasibility for the Illumina MethylationEPIC microarray demonstrates good correlation of >850K CpG methylation sites in addition to 59 human rsID sites. Specifically, R^2 between all paired TAP and VP samples from the same donors is >0.99, indicating high correlation and fidelity. Accessible and minimally invasive sampling with the TAP device can enable cost-effective methylation assessments over time, particularly for age-related biological conditions and applications. Remote collections with TAP can enable access, high-throughput and disease modeling for methylation changes over time. The purpose of this study is to demonstrate technology and platform capability of the TAP device with the Illumina methylation microarray. Further evaluation of the TAP device could benefit from a larger sample size and comparisons to additional sample types such as saliva and dried blood spots. Future studies will explore cytogenetic microarrays and comparisons to other orthogonal methylation platforms to assess the same CpG islands to demonstrate cross-platform concordance. Additional considerations may include disease vs. non-disease donors to look at select methylation sites (for example, oncology-related sites of interest).