-
Whitepaper
How ImYoo is decentralizing immune profiling at single-cell resolution
This whitepaper describes ImYoo’s end-to-end platform which integrates YourBio Health’s TAP II virtually painless at-home blood collection device, multiplexed single-cell RNA sequencing, and automated data analysis. With this platform ImYoo is creating a growing capillary blood single-cell RNA sequencing (scRNA-seq) database with a resolution of 40 cell subtypes.
This is complemented by custom built computational infrastructure that enables data integration and iterative hypothesis testing on new and existing datasets.

Patients self-collect capillary blood at home using TAP II
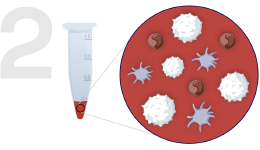
ImYoo processes immune cells at single-cell resolution

ImYoo identifies cell and patient-specific signatures across time
September 2022
Introduction
New assays for interrogating the immune system, such as single-cell RNA sequencing, are being explored and adopted in research studies and clinical settings to predict response to therapies, diagnose patients, and understand immune variability. The volume of sample needed for many sequencing-based assays is far lower than what is typically extracted in a venous blood draw with phlebotomists, but this is still the industry standard blood extraction procedure. The need for patients to get invasive blood draws at clinical study centers perpetuates three challenges in immunology research:
(i) patient drop-out from studies;
(ii) difficulty in obtaining high-frequency temporal data;
(iii) access to patients distant from clinical study centers.
These challenges present limitations to studying and deploying timely personalized diagnoses and treatments for patients whose diseases have highly variable patterns. Many autoimmune conditions such as inflammatory bowel disease manifest themselves through flare-ups that make it a challenge for patients to come into the clinic for a blood draw. The importance of longitudinal studies is well-established, and has been highlighted in a study tracking individuals with rheumatoid arthritis across time to find cell-specific gene expression markers that emerge up to two weeks before the start of a flare [1]. ImYoo is building a platform for investigating the complex temporal dynamics of immune-mediated conditions by enabling patients to self-collect blood at home using YourBio Health’s TAP II self-collection device while capturing high resolution data on their immune systems via single-cell RNA sequencing.
Over 40 immune cell subtypes can be recovered from small volumes of capillary blood self collected by patients using YourBio Health’s TAP II device.
ImYoo’s small volume isolation procedure recovers about 100k white blood cells per 150 microliter sample of capillary blood. By using the YourBio Health’s TAP II self-collection device, we have built up a database of self-collected capillary blood immune profiles from over 100 people.
We combined these with single-cell RNA immune profiles with an additional 88 samples of venous blood and 60 buffy coat samples to build a joint database of human immune variability. Altogether, ImYoo’s database contains over 2.4M single cells and nuclei processed from a variety of source samples, and the large number of samples enabled identification of over 40 unique immune cell subtypes. Over 40 immune cell subtypes can be recovered from small volumes of capillary blood self collected by patients using YourBio Health’s TAP II device.
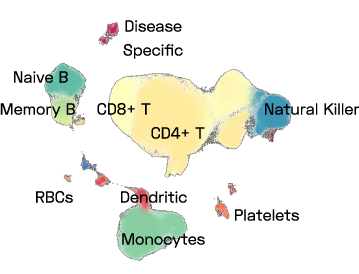
Figure 1: A UMAP of a subset of ImYoo’s database showing 1M high quality PBMCs consistently processed by ImYoo from fresh blood samples of capillary and venous blood.
ImYoo’s database contains over 2.4M single cells and nuclei processed from a variety of source samples.
Single-cell immune profiling of capillary blood reveals molecular signatures in individuals diagnosed with disease
In our database, we found a B cell cluster that contained cells predominantly from an individual with a reported diagnosed condition. This cluster expressed 16 genes that were uniquely expressed compared to other B cells. Surprisingly, we also found an additional subject with an unknown, undiagnosed condition that had a large number of cells that belonged to this cluster. This finding highlights the benefit of having a reference database that can be used to situate immune findings from individuals in the context of other diseases.

Figure 2: Disease specific signatures identified at molecular resolution in capillary blood.
We are also able to break down the different cell type distributions in the case of disease. Figure 3 shows how CD8+ T cells are more abundant in Disease C compared to healthy controls and other conditions. These examples illustrate that high-resolution insights pertaining to disease can be made using small volumes of self-collected capillary blood.
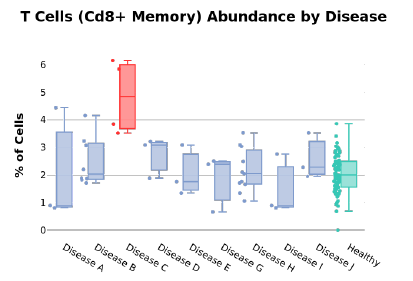
Figure 3: T cell abundance per disease.
Temporal sampling shows robust cell-specific gene markers in individuals over time
Expression of genes depends on time of day and results in different cellular states driving innate and adaptive immune responses. Conditions such as allergies and infections have been known to display diurnal behaviors [3]. Point of care self-collections of blood facilitates sample collections at multiple time points, enabling the elucidation of diurnal or other temporally oscillating effects for genes and cells of interest.
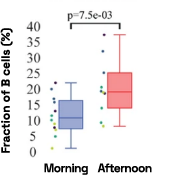
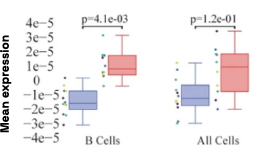
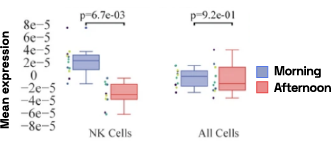
Figure 4: Cell-specific gene abundance changes in capillary blood over mornings and afternoons.
In our prior work, we performed twice-daily sampling on 4 subjects, and identified cell-specific genes that exhibit diurnal patterns, such as IFI16 in natural killer cells, and LSP1 in B cells [2]. We can also see that B cell abundance is higher in the afternoon compared to morning (Figure 4). Importantly, due to the natural variability between people, these findings were only possible to identify with a small subject pool by baselining each individual against themselves.
Individual molecular fingerprints are robust to cell isolation procedure and sample processing delay on ice
Previous work from the Allen Institute for Immunology has revealed dramatic changes to gene expression in cell subtypes when blood samples are delayed from being processed for more than 4 hours [4]. ImYoo performed a study that validated this result, highlighting the importance of sample processing logistics for single-cell RNA analysis. In order to demonstrate that at-home sampling could provide high quality data, we performed a study to see whether cold storage could reduce the effect on gene expression. In this study 2 subjects self-collected blood once per week for 4 weeks, and one aliquot was immediately cryopreserved, while another was left on ice for 24 hours prior to cryopreservation, for a total of 8 pairwise samples. Gene expression of these samples was compared within 9 different cell types, showing a very strong correlation (mean r2=0.98) (Figure 5).
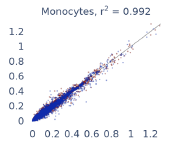
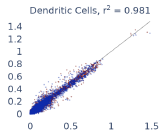
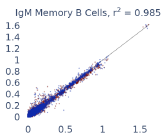

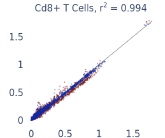
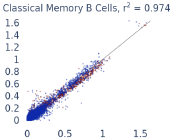
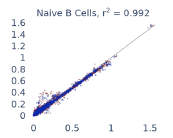
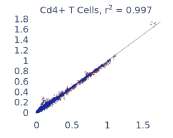
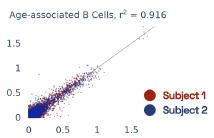
Figure 5: Comparison of differences in gene expression for different cell types in the same sample processed immediately vs kept on ice for 24h prior to processing. Samples were taken from two subjects four times on different weeks.
In our prior work, we identified gene expression differences in these same individuals at single-cell resolution that were stable over time [2], referred in figure 6 as study A. The top most individual-specific genes for these individuals, LIPA (Lysosomal Acid Lipase) in Monocytes and MYOM2 in natural killer cells, were both still significantly different than the reference database, despite differences in cell isolation procedures, reference samples, 10X protocol version, and whether they were processed fresh or after 24 hours on ice, underlining the stability of such fingerprint signals.
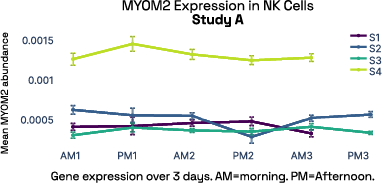
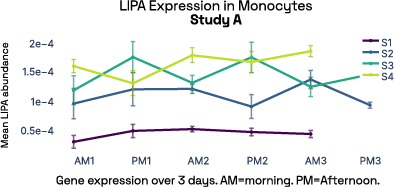
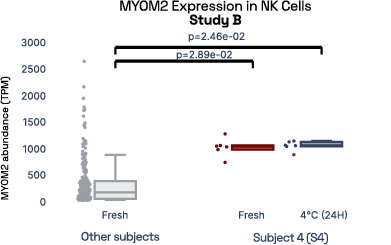
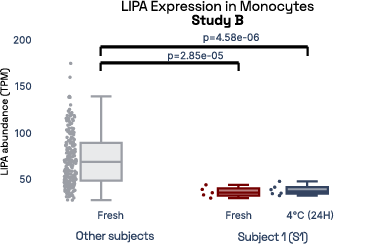
Figure 6: Consistent finding of a molecular fingerprint across different studies. Left panels: expression of MYOM2 in NK cells is consistently higher in Subject 4 (S4) than other subjects in both studies A and B. Right panels: expression of LIPA in monocyte cells is consistently lower in subject 1 (S1) than in other subjects in both studies A and B.
Comparing cell type distributions in venous vs capillary PBMCs
Venous blood is currently the standard liquid biopsy approach for surveying the immune system. We compared the major cell type distributions between the venous and capillary immune cells in ImYoo’s database. Shifts in the proportions of certain cell types were consistently observed, but these do not impair downstream analysis and data quality, as all cell types are consistently obtained in both venous and capillary samples.
Both sample types were processed through the same single cell RNA sequencing workflow. The isolation of venous PBMCs was performed by a third party, and may account for some of the differences seen. TNK cells, which include T and Natural Killer cells, are significantly more present in capillary blood samples compared to venous (Fig. 7). However, when we expanded the hierarchy of TNK cells to CD4+, CD8+, and Natural Killers, there were no significant differences between venous and capillary blood in relative subtype proportions.
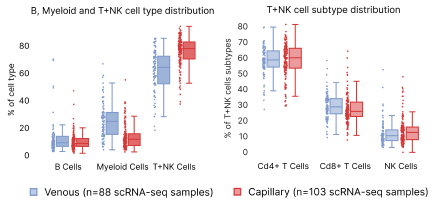
Figure 7: Distribution differences in capillary vs. venous PBMCs. Panel (a) shows the high level distributions of B, Myeloid and T+NK cells. Panel B shows differences in the subpopulations grouped under T+NK cells.
In contrast, we observed a lower proportion of myeloid cells, such as monocytes and dendritic cells (DC), in capillary blood samples (Fig. 8). The reduction in monocyte proportions agrees with our previous finding which was done using a different cell isolation procedure, boosting our confidence that this results from differences in capillary blood [2]. Looking deeper into the myeloid hierarchy, we observed that classical, intermediate, and non-classical monocytes contribute to the reduced myeloid cell presence in the capillary blood. B cells and their corresponding subtypes remain similar across venous and capillary blood. Despite these differences, we were able to corroborate analyses performed within both blood extraction types.
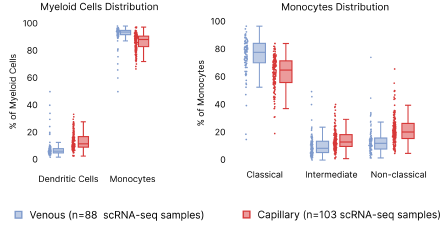
Figure 8: Distribution differences in capillary vs. venous PBMCs. Left: Distribution of Dendritic cells and monocyte abundance per scRNA-seq sample. Right: differences in the monocyte subpopulations.
For example, we identified a cell type for which the cell distribution changes across age in both capillary and venous blood samples (Fig. 4). Out of caution, we would like to note that variables such as cell isolation protocols, storage duration, and study demographics, could also play a role in the distribution differences observed.
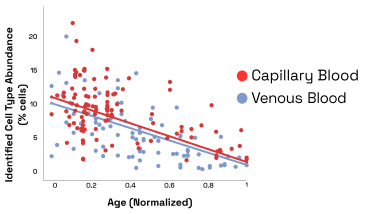
Figure 9: Abundance of age related cell type vs age for venous and capillary blood samples
Conclusion
ImYoo is an emerging biotech start-up and we continue to evolve our platform. In this short technical note, we highlight our platform’s ability to identify disease specific signatures and individual cell-specific markers robustly expressed across time. We are looking for partners interested in conducting temporal studies or leveraging our existing database to enhance their
single-cell analysis. To understand current and upcoming developments, you can contact us at contact@imyoo.health or via our website at https://imyoo.health.
References
Patent US20210324447A1: Immune profiling using small volume blood samples
[1] Orange et al 2020. RNA Identification of PRIME Cells Predicting Rheumatoid Arthritis Flares.
DOI: 10.1056/NEJMoa2004114
[2] Dobreva et al 2020. Single cell profiling of capillary blood enables out of clinic human immunity studies.
DOI: 10.1038/s41598-020-77073-3
[3] Pick et al 2019. Time-of-Day-Dependent Trafficking and Function of Leukocyte Subsets.
DOI: 10.1016/j.it.2019.03.010
[4] Savage 2021. Multimodal analysis for human ex vivo studies shows extensive molecular changes from delays in blood processing.
DOI: 10.1016/j.isci.2021.102404